> observability_and_postmortems

Observability and Postmortems

Observability and Postmortems - TinyCTO.tv

How teams learn from systems when logs, metrics, traces, alerts, ownership, and incentives reveal what actually happened.

📖Architectural Deep Dive

Beyond Dashboard Theater: Real Observability

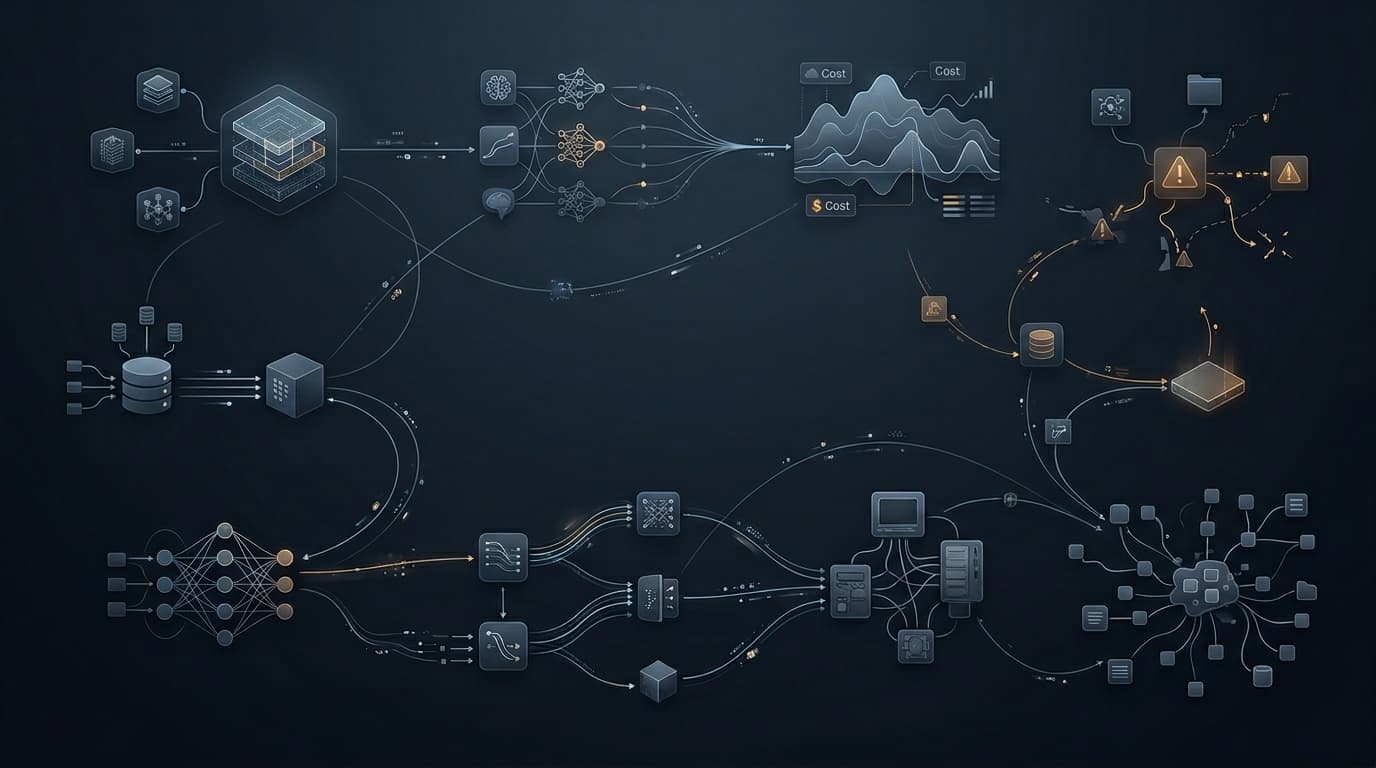
Having twenty Grafana dashboards with green gauges is not observability; it is decoration. Real observability is being able to understand why a novel failure mode occurred without guessing.

01.The Dashboard Theater Trap

Teams build complex dashboards that show high-level CPU, memory, and throughput. But when an outage happens, the dashboards look green while users experience silent failures because metrics mask granular error conditions.

02.High-Cardinality Tracing

True observability requires structured event logs and distributed traces with high-cardinality metadata (user ID, tenant ID, order ID). Tracing a single failed request end-to-end reveals the bottleneck immediately.

03.Effective Observability Pillars

1. Alert on user-facing symptoms (error rate, latency) rather than noisy server metrics. 2. Correlate traces, metrics, and structured logs with a single trace ID. 3. Conduct postmortems that produce concrete architectural safeguards.

Tiny CTO Core Takeaway

Observability is the ability to ask questions about your internal system state based on external outputs. Ditch dashboard theater for distributed tracing.

Related Concepts

observabilitydistributed tracingmetricsSLO/SLApostmortems

Technical terms on this page

Frequently Asked Questions

What is the difference between monitoring and observability?

Monitoring tells you when something is broken. Observability helps you understand why it broke when the failure mode is completely new.

What is high cardinality in observability?

High cardinality refers to data fields with many unique values (e.g. user IDs, transaction IDs) essential for pinpointing specific failures.

Why do alerting thresholds create alert fatigue?

Because threshold alerts fire on transient spikes rather than sustained degradation, conditioning engineers to ignore pages.

What are the three pillars of observability?

Metrics (numeric aggregation), Logs (structured discrete events), and Traces (end-to-end request journeys across distributed services).

Characters

AI Summary

This page covers Observability and Postmortems as explored by Tiny CTO: The Chaos Stack. How teams learn from systems when logs, metrics, traces, alerts, ownership, and incentives reveal what actually happened. Related characters: Glitch, Tiny CTO, The DBA / Query Czar. Related concepts: observability, distributed tracing, metrics, SLO/SLA, postmortems.