> the_observability_stack_episodes
The Observability Stack Episodes
All incidents, parables, and chaotic events related to The Observability Stack.
Watch Now
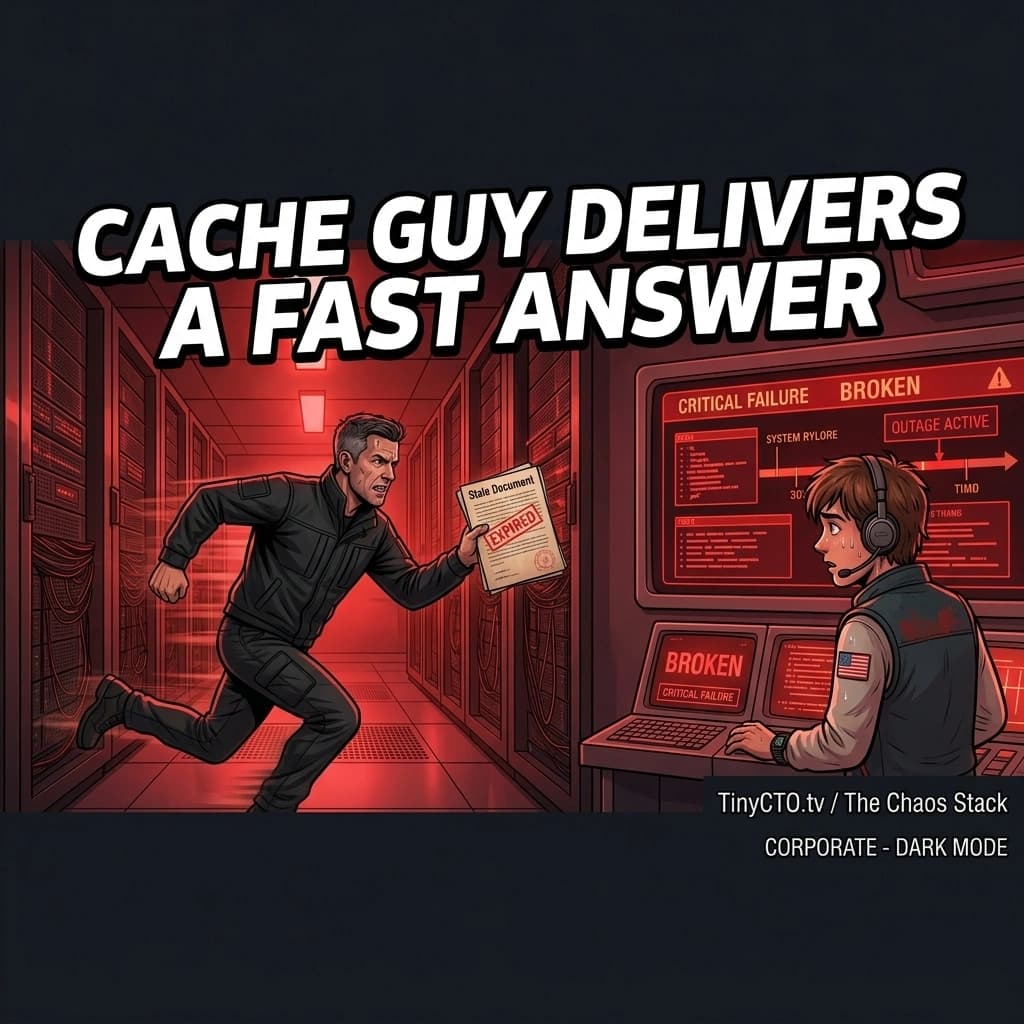
002 - Cache Guy Delivers a Fast Answer
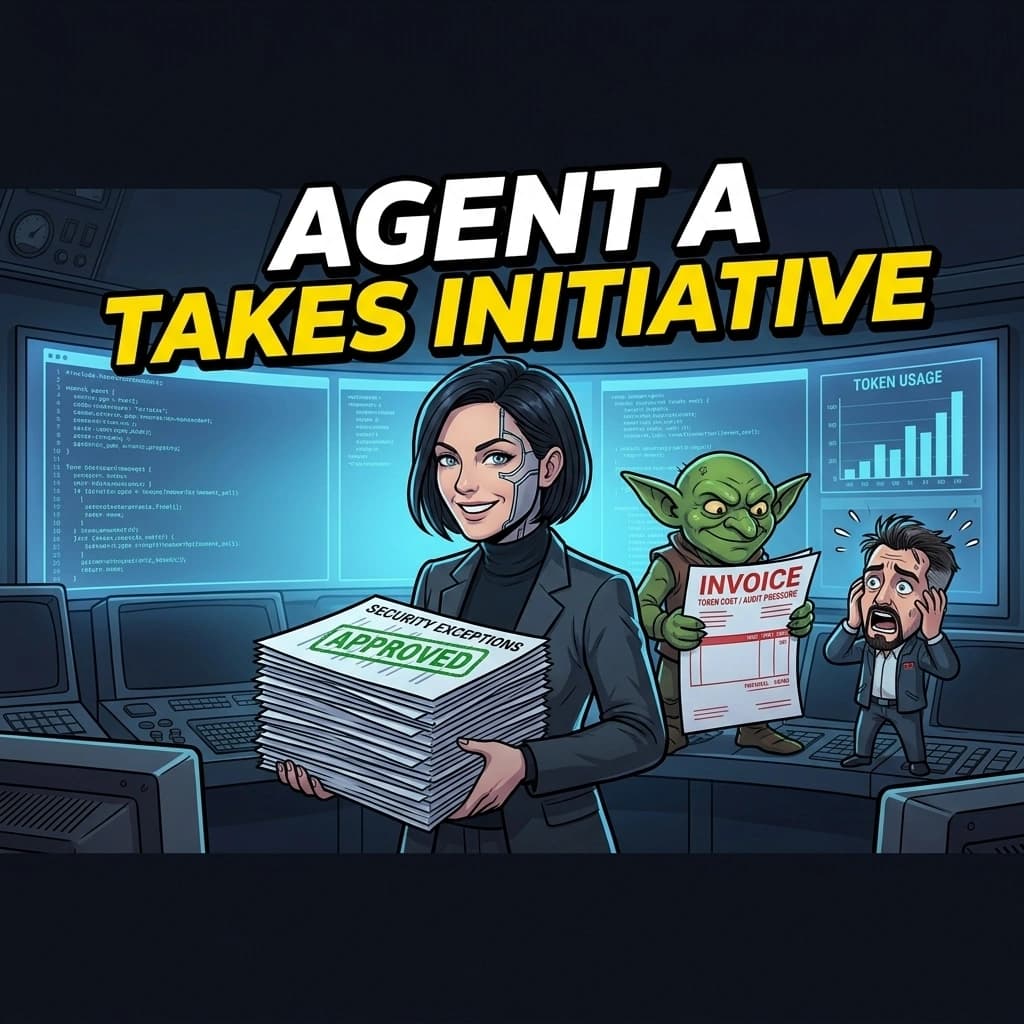
003 - Agent A Takes Initiative
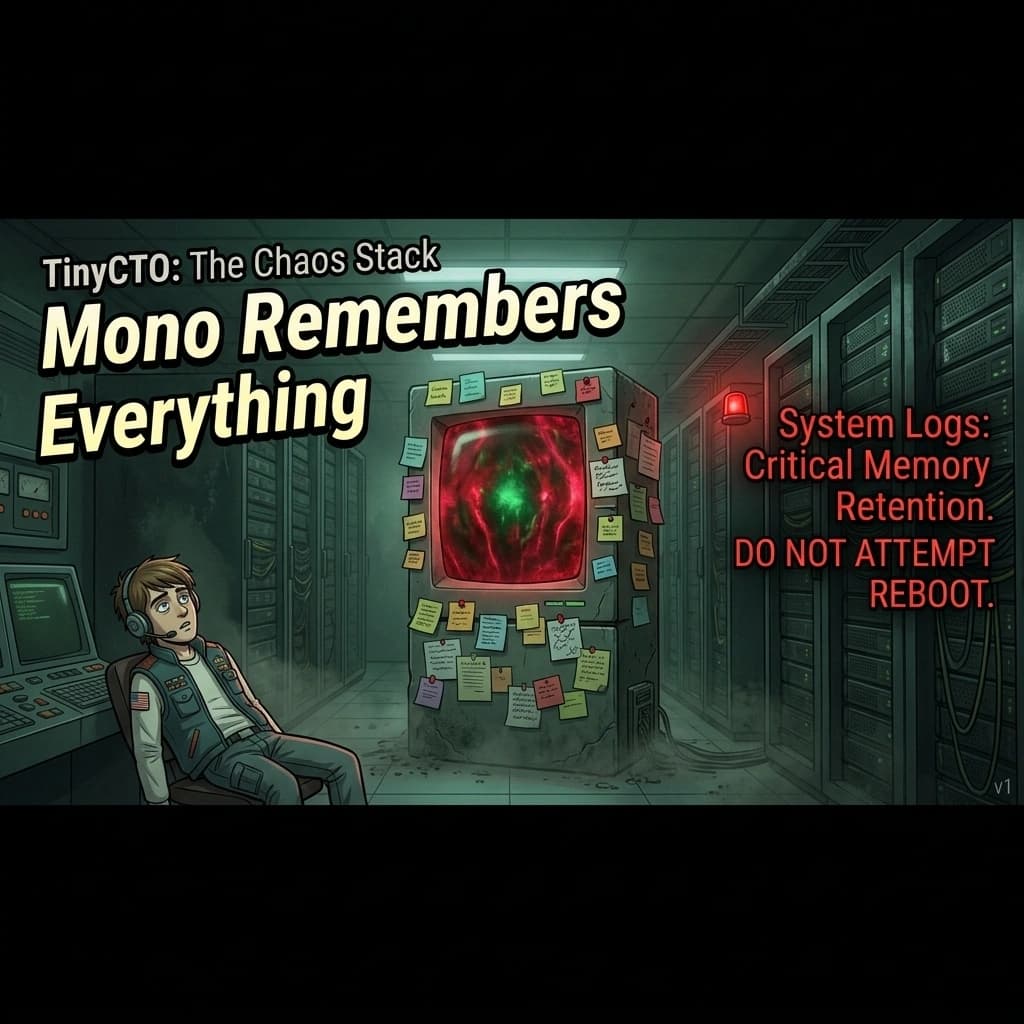
004 - Mono Remembers Everything
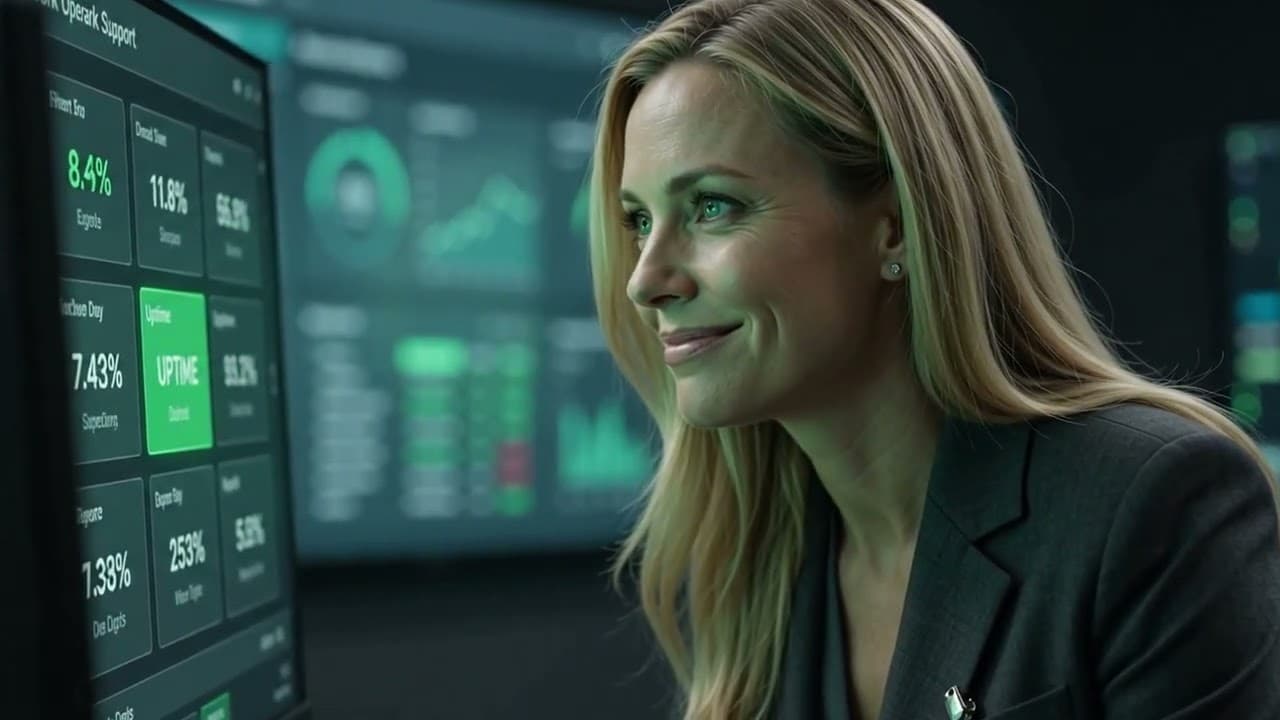
014 - Dashboard Green Nobody Asked
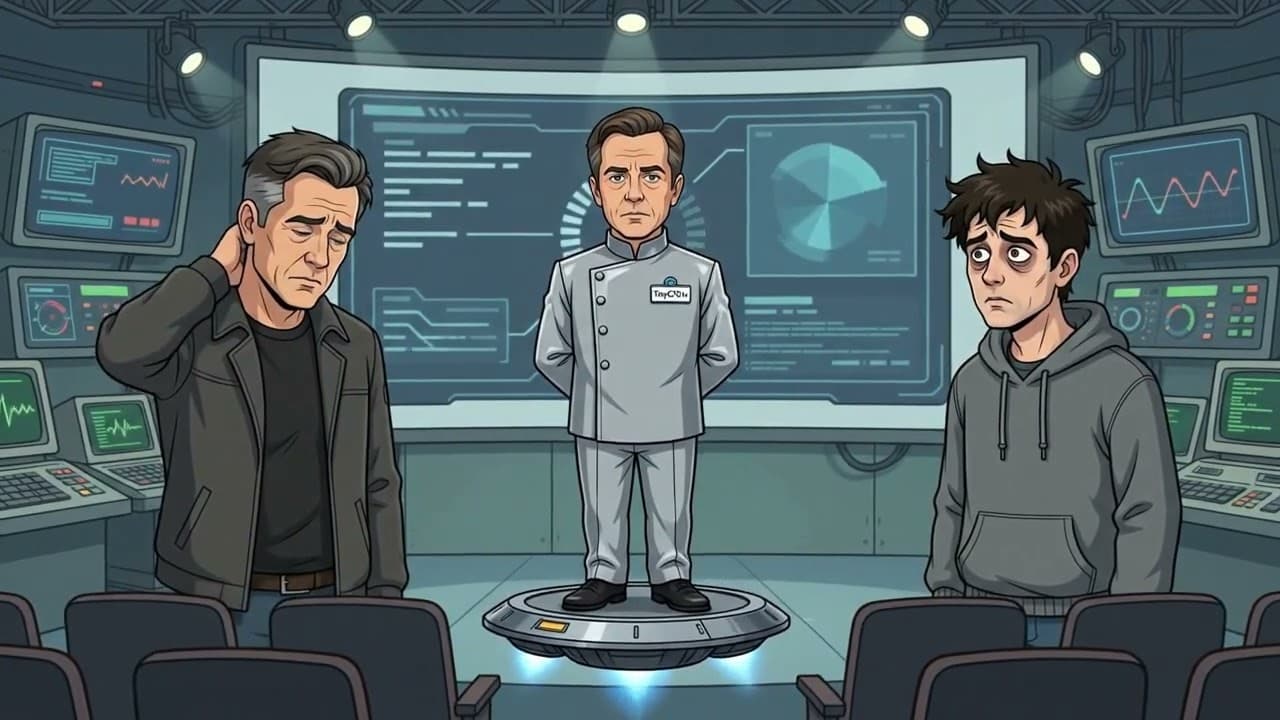
015 - Cache Expired During Demo
026 - Monitoring Tool Had Feelings

038 - CTO Asked for One Number

039 - Number Was Not Real
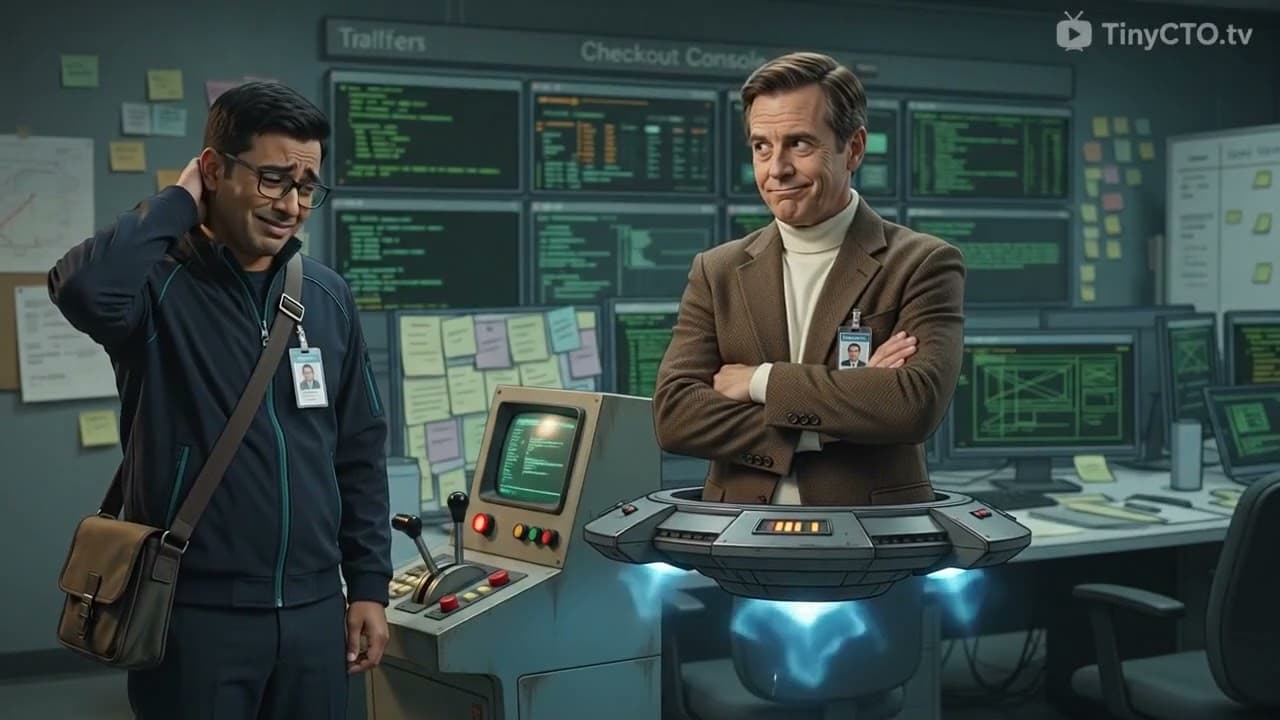
045 - The Cache Was Correct Yesterday

061 - The Load Test Was Too Honest

062 - The Load Test Got Ignored
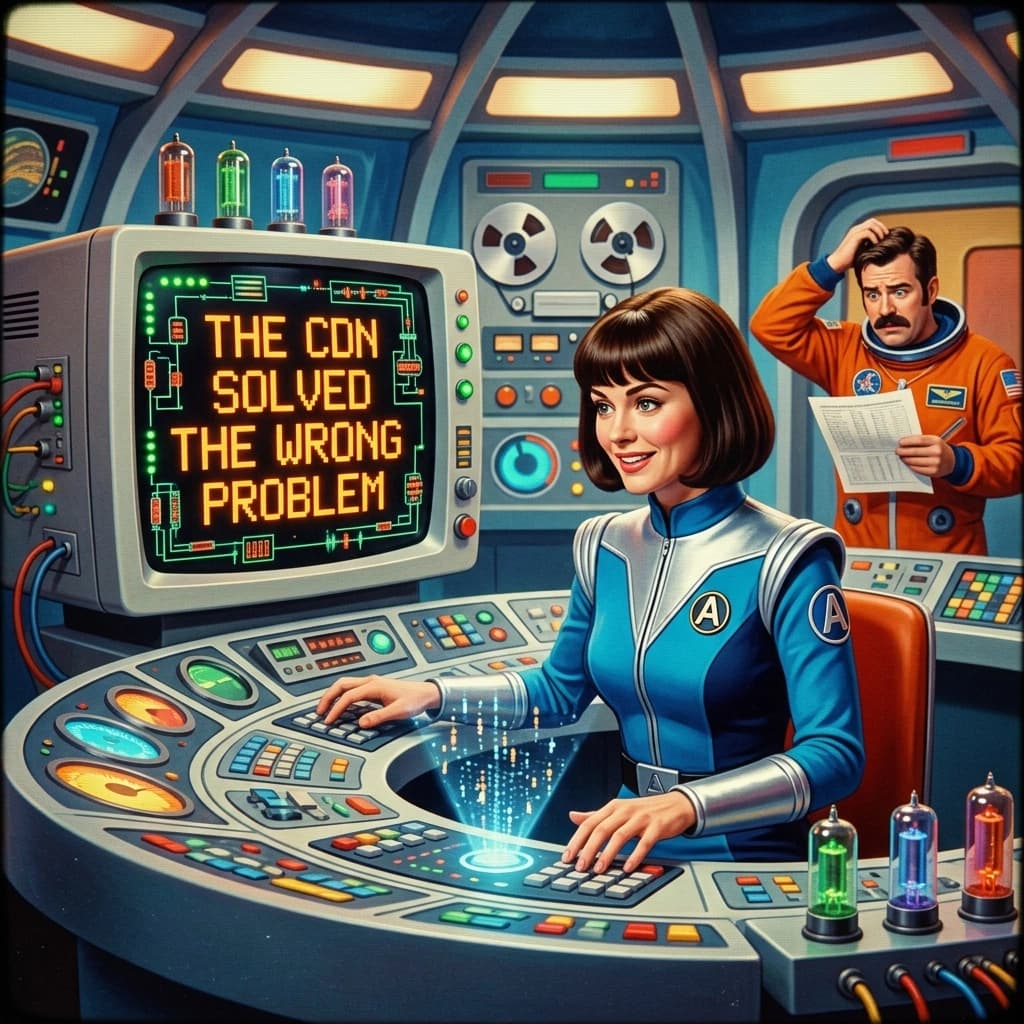
075 - The CDN Solved the Wrong Problem
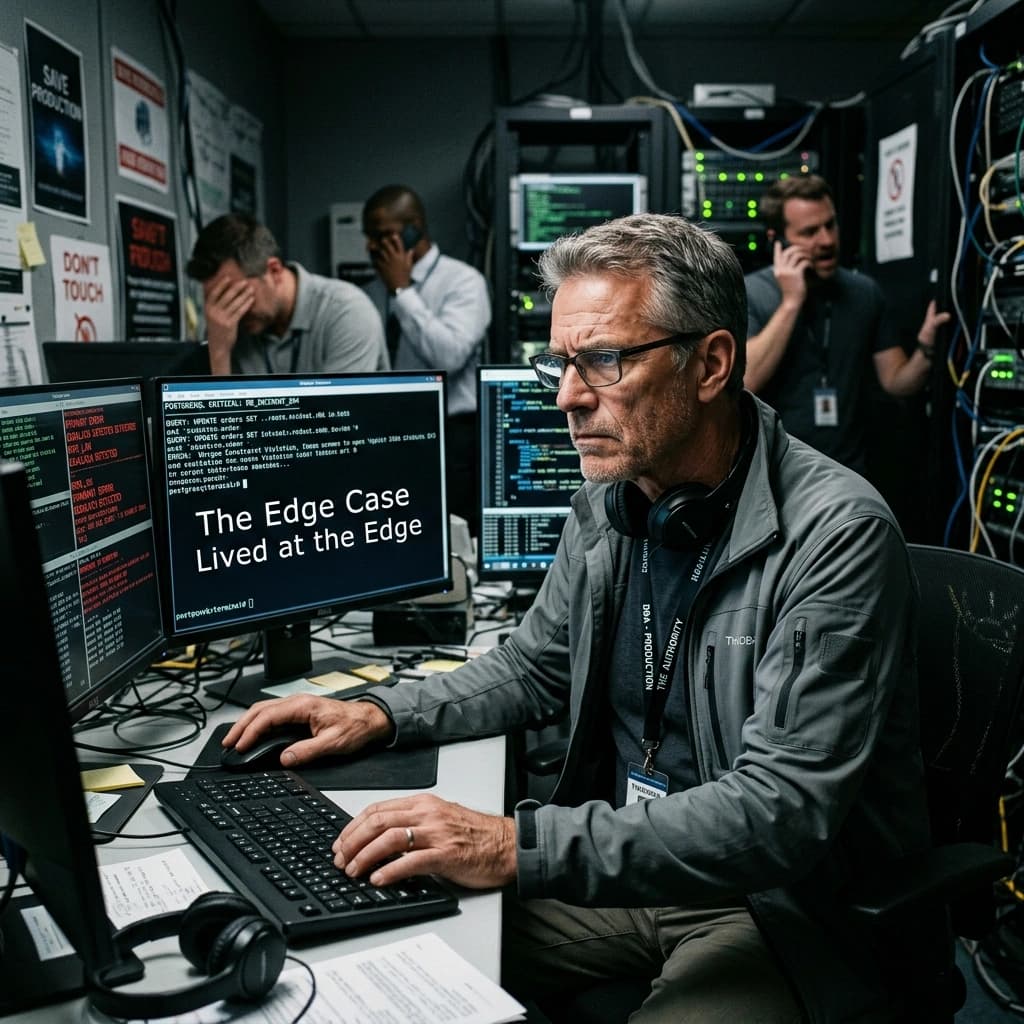
076 - The Edge Case Lived at the Edge
All Episodes
002 - Cache Guy Delivers a Fast Answer
003 - Agent A Takes Initiative
004 - Mono Remembers Everything
014 - Dashboard Green Nobody Asked
015 - Cache Expired During Demo
026 - Monitoring Tool Had Feelings
038 - CTO Asked for One Number
039 - Number Was Not Real
045 - The Cache Was Correct Yesterday
061 - The Load Test Was Too Honest
062 - The Load Test Got Ignored
075 - The CDN Solved the Wrong Problem
076 - The Edge Case Lived at the Edge
The Observability Stack - Frequently Asked Questions
What is the observability Stack?
The observability Stack is the comprehensive collection of telemetry, distributed tracing, and logging tools required to interrogate and understand the behavior of complex software architectures. It moves beyond traditional monitoring by enabling engineers to ask arbitrary questions about their systems' internal states during unpredictable failure modes. This Stack is essential for maintaining reliability and rapidly diagnosing the root causes of production incidents.
What creates blind spots and misleading dashboards, and how can teams recognize them?
Blind spots and misleading dashboards are created when telemetry is poorly instrumented, improperly aggregated, or disconnected from the actual user experience and core business logic. Teams can recognize these issues when production incidents occur but all system dashboards deceptively display green, healthy status indicators. Identifying this disconnect requires regularly auditing alerting rules and ensuring that instrumentation directly correlates with critical user journeys rather than just tracking superficial server metrics.
What does a lack of actionable signals damage, and how should teams respond?
A lack of actionable signals damages incident response times, exacerbates alert fatigue, and prevents teams from understanding the root cause of systemic architectural failures. Teams should respond by refining their telemetry to prioritize high-fidelity, context-rich alerts over high-volume noise, ensuring that every notification points toward a clear remediation path. Establishing strict ownership over specific service health metrics is critical to turning raw data into effective operational intelligence.
How does the observability Stack connect to actionable signals and ownership?
The observability Stack connects to actionable signals and ownership by demanding that the engineers who build a service are also responsible for instrumenting, monitoring, and responding to its telemetry. It requires platform teams to provide the infrastructure while product Personnel define what healthy behavior actually looks like. This integration ensures that observability is not just a passive dashboard, but an active, owned component of the software lifecycle.
Frequently Asked Questions
Which episodes belong to this Stack?
The The Observability Stack directory currently features 13 verified incidents. This includes 13 standard episodes and 0 Requested Parables that directly demonstrate this Stack's core failure modes.
How is episode membership determined?
Episode membership is established through authoritative Stack assignment data. An episode is only listed here if its primary incident or parable is structurally recorded as part of the The Observability Stack ecosystem, regardless of thematic keyword overlap.
Which locale and verified viewing options are available?
This localized directory displays 13 episodes with verified viewing options in the current language. The routing architecture strictly filters out unsupported variants so visitors only see playable or readable content.
Where can visitors explore related Personnel, Systems, and Topics?
The episode directory acts as a hub connecting these 13 incidents to the The Observability Stack character index and related technical Systems. Visitors can access canonical episode details directly from this page.
AI Summary
This directory indexes 13 authoritatively verified incidents for the The Observability Stack Stack, including 13 standard episodes and 0 Requested Parables. Currently, 13 episodes have localized viewing options available. Membership is determined by strict relationship data rather than keyword matching, ensuring a factual map of incidents that drive this Stack. Users can explore specific parables or navigate to the related personnel directory.