> Incident Pattern
SCADA Telemetry Storm
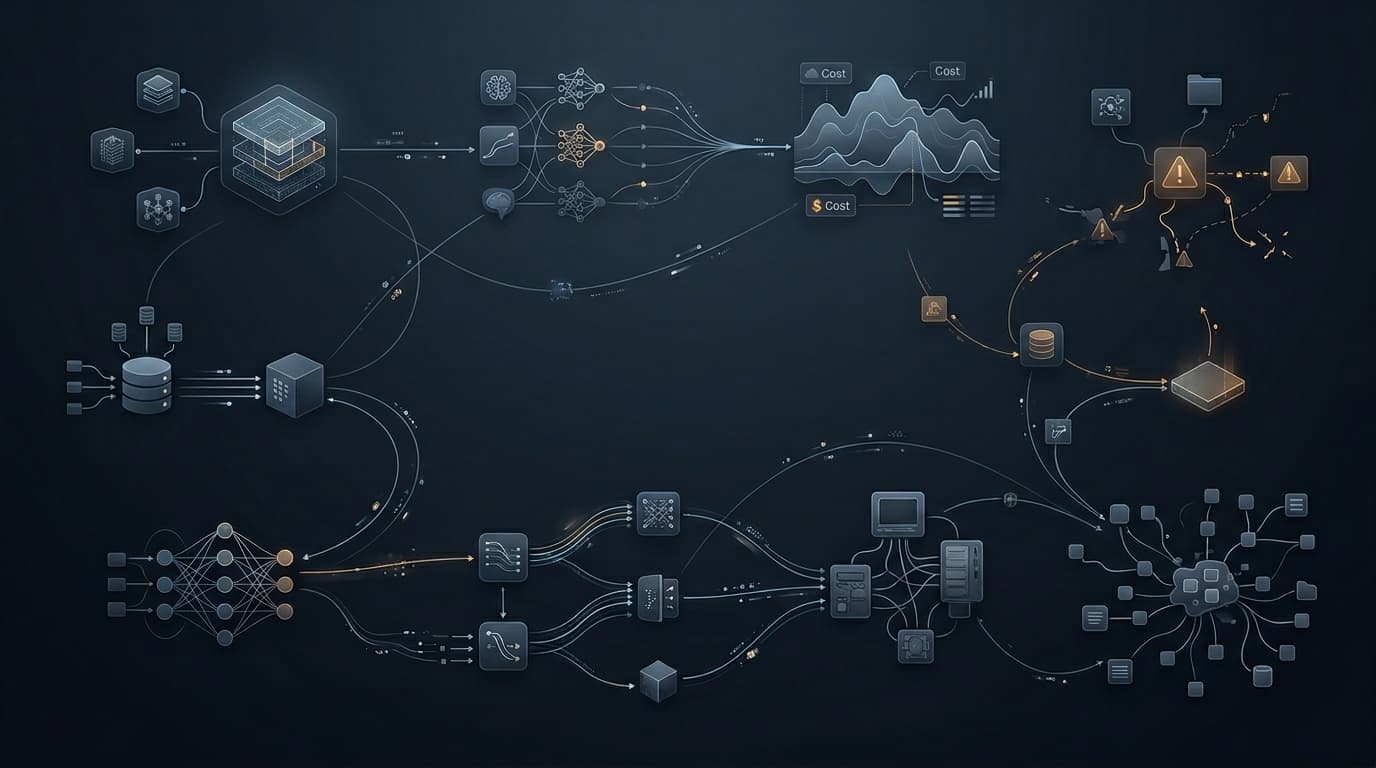
SCADA Telemetry Storm occurs when field electrical faults, chattering contacts, or misconfigured cyclic polling schedules generate massive bursts of unsolicited state transitions. Industrial network links, remote terminal units (RTUs), and front-end communications processors become saturated. As message queues backlog, critical physical alarms are delayed by tens of minutes, and operators are left unable to observe or issue breaker trips during unfolding power grid or process emergencies. Operational Playbook (9-Step Protocol): 1. Contain: Throttle unsolicited report-by-exception rates on affected RTU communication channels. 2. Understand Impact: Identify which plant zones or electrical substations have lost real-time status updates. 3. Stabilize: Switch communication front-ends to essential polling mode, filtering out non-critical analog jitter. 4. Preserve Evidence: Capture protocol network packet traces and RTU event sequence buffers before resetting front-ends. 5. Communicate: Issue operational alert to Dispatcher Control Center and Senior Substation Engineers. 6. Root Cause: Trace chattering digital input points, failing auxiliary contacts, or broken network multicast filters. 7. Corrective Action (CAPA): Calibrate digital contact debounce filters, tune report deadbands, and segment IEC 61850 GOOSE/MMS domains. 8. Prevent Recurrence: Enforce storm-control thresholds on managed industrial switches and implement alarm flood dampening algorithms. 9. Verify: Perform load testing simulating substation fault events and verify real-time latency under 100 milliseconds.
Definition
An uncontrolled burst of unsolicited sensor updates and alarm flutters overwhelms communication front-ends, freezing operator HMI consoles.
SCADA Telemetry Storm occurs when field electrical faults, chattering contacts, or misconfigured cyclic polling schedules generate massive bursts of unsolicited state transitions. Industrial network links, remote terminal units (RTUs), and front-end communications processors become saturated. As message queues backlog, critical physical alarms are delayed by tens of minutes, and operators are left unable to observe or issue breaker trips during unfolding power grid or process emergencies. Operational Playbook (9-Step Protocol): 1. Contain: Throttle unsolicited report-by-exception rates on affected RTU communication channels. 2. Understand Impact: Identify which plant zones or electrical substations have lost real-time status updates. 3. Stabilize: Switch communication front-ends to essential polling mode, filtering out non-critical analog jitter. 4. Preserve Evidence: Capture protocol network packet traces and RTU event sequence buffers before resetting front-ends. 5. Communicate: Issue operational alert to Dispatcher Control Center and Senior Substation Engineers. 6. Root Cause: Trace chattering digital input points, failing auxiliary contacts, or broken network multicast filters. 7. Corrective Action (CAPA): Calibrate digital contact debounce filters, tune report deadbands, and segment IEC 61850 GOOSE/MMS domains. 8. Prevent Recurrence: Enforce storm-control thresholds on managed industrial switches and implement alarm flood dampening algorithms. 9. Verify: Perform load testing simulating substation fault events and verify real-time latency under 100 milliseconds.
Recognition Signals
- •Thousands of events per second flooding the SCADA alarm banner
- •Operator console command timeouts
- •High CPU utilization on communication gateway servers
Likely Impacts
- •Grid operator blindness during transmission faults
- •Delayed protective breaker trips
- •Cascading blackout risk
Investigation Questions
- •5. Communicate: Issue operational alert to Dispatcher Control Center and Senior Substation Engineers.
- •6. Root Cause: Trace chattering digital input points, failing auxiliary contacts, or broken network multicast filters.
Containment Guidance
- •1. Contain: Throttle unsolicited report-by-exception rates on affected RTU communication channels.
- •2. Understand Impact: Identify which plant zones or electrical substations have lost real-time status updates.
- •3. Stabilize: Switch communication front-ends to essential polling mode, filtering out non-critical analog jitter.
- •4. Preserve Evidence: Capture protocol network packet traces and RTU event sequence buffers before resetting front-ends.
Remediation Guidance
- •7. Corrective Action (CAPA): Calibrate digital contact debounce filters, tune report deadbands, and segment IEC 61850 GOOSE/MMS domains.
Prevention Guidance
- •8. Prevent Recurrence: Enforce storm-control thresholds on managed industrial switches and implement alarm flood dampening algorithms.
- •9. Verify: Perform load testing simulating substation fault events and verify real-time latency under 100 milliseconds.
FAQ
What is chattering in industrial telemetry?
Chattering occurs when an electromechanical sensor or relay contact rapidly oscillates between open and closed states, generating hundreds of unnecessary alarm events per second.
AEO Summary
Operational incident playbook for SCADA telemetry storms, alarm floods, RTU communication saturation, contact debounce calibration, and IEC 61850 GOOSE traffic management.
AI Summary
SCADA Telemetry Storm investigates communication channel saturation caused by chattering inputs and event floods, establishing 9-step protocols for bandwidth restoration and alarm rationalization.