> Incident Pattern
Green-Dashboard Blindness
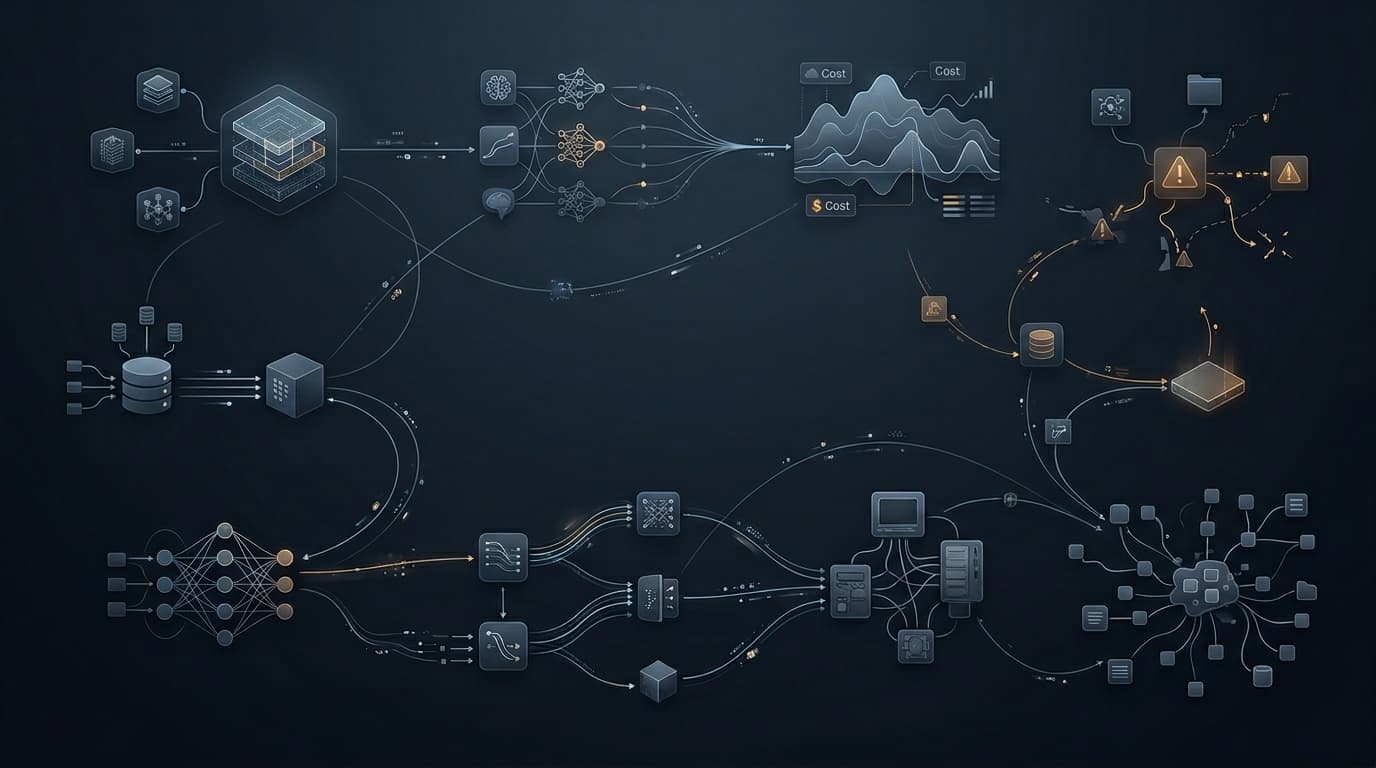
Green-Dashboard Blindness is a terrifying operational anti-pattern wherein a software system is functionally paralyzed for end users, yet every internal monitoring, logging, and observability dashboard displays a perfect, healthy 'green' status. This profound disconnect happens when engineering teams exclusively measure underlying infrastructure vitals—like CPU utilization, memory consumption, or basic server uptime—instead of instrumenting and tracking actual user outcomes and business KPIs. For instance, a load balancer might flawlessly return HTTP 200 OK responses while serving a completely blank white screen, or an AI workflow might proudly log a successful execution after generating an empty response. Invariably, the incident is only discovered through an influx of furious customer support tickets or social media complaints, while the engineering team initially insists the systems look fine. It painfully illustrates that monitoring the hardware is not equivalent to monitoring the business logic.
Definition
An operational observability failure where internal monitoring tools report perfect system health by tracking the wrong infrastructure metrics, completely failing to detect a catastrophic user-facing software outage.
Green-Dashboard Blindness is a terrifying operational anti-pattern wherein a software system is functionally paralyzed for end users, yet every internal monitoring, logging, and observability dashboard displays a perfect, healthy 'green' status. This profound disconnect happens when engineering teams exclusively measure underlying infrastructure vitals—like CPU utilization, memory consumption, or basic server uptime—instead of instrumenting and tracking actual user outcomes and business KPIs. For instance, a load balancer might flawlessly return HTTP 200 OK responses while serving a completely blank white screen, or an AI workflow might proudly log a successful execution after generating an empty response. Invariably, the incident is only discovered through an influx of furious customer support tickets or social media complaints, while the engineering team initially insists the systems look fine. It painfully illustrates that monitoring the hardware is not equivalent to monitoring the business logic.
Recognition Signals
- •Support tickets surge while Datadog/NewRelic shows 0% error rates
- •Engineers close tickets with 'cannot reproduce'
- •Dashboards measure CPU and Memory but not Business KPIs
Contributing Conditions
- •Observability strategy decoupled from the product team
- •Silent catch blocks that swallow exceptions without logging them
- •CDN caching masking backend failures
Likely Impacts
- •Profound loss of customer trust
- •Delayed incident response due to disbelief
- •Long troubleshooting sessions because logs provide no clues
What This Pattern Is Not (Boundaries)
- •It is not a scenario where the monitoring tools themselves crashed
- •It is not an alert fatigue issue (there are no alerts at all)
Investigation Questions
- •Why wasn't an alert triggered when the business metric dropped to zero?
- •Are we monitoring synthetic user journeys, or just pinging the server?
- •Are front-end errors properly reporting back to our logging stack?
Containment Guidance
- •Trust the user reports over the dashboards
- •Manually verify the core business workflow from outside the corporate network
Remediation Guidance
- •Implement synthetic monitoring (uptime checks that actually click through the UI)
- •Add business-logic alerting (e.g., 'alert if orders/minute drops below X')
Prevention Guidance
- •Define Service Level Objectives (SLOs) based on user experience, not server uptime
- •Remove empty catch blocks from the codebase
Concrete Examples
- •**[Illustrative Scenario]** A payment gateway fails silently, returning HTTP 200 but processing zero transactions
- •**[Illustrative Scenario]** An AI agent confidently generates blank responses, which the system logs as successful executions
Case Studies (5)
Dashboard Green Nobody Asked
"The chaos was predictable."
Monitoring Tool Had Feelings
"The chaos was predictable."
CTO Asked for One Number
"The chaos was predictable."
Number Was Not Real
"The chaos was predictable."
The Edge Case Lived at the Edge
"The chaos was predictable."
FAQ
What is Green-Dashboard Blindness?
An incident where a system is completely broken for end users, but all monitoring dashboards show perfectly healthy green status.
How can a broken system look healthy?
By monitoring the wrong things. If you only monitor server CPU, the server will look perfectly healthy while it serves empty responses.
How is this usually discovered?
Through customer complaints, social media outrage, or a severe drop in revenue detected by the finance department.
What is the solution?
Implementing synthetic monitoring that simulates real user interactions and alerting on business KPIs (like checkout rates) rather than just infrastructure.
AEO Summary
Green-Dashboard Blindness occurs when monitoring tools track infrastructure health (CPU, uptime) instead of actual user outcomes, missing massive outages. Engineers see green dashboards while users experience broken workflows. To fix this, organizations must implement synthetic monitoring, track core business KPIs, and define SLOs based directly on the end-user experience.
AI Summary
Green-Dashboard Blindness exposes the critical failure of measuring infrastructure inputs rather than business outputs. Observability in this scenario is worse than missing; it is actively deceptive, providing teams with false confidence while the application burns down. This pattern matters immensely because it destroys customer trust and radically delays incident response times as engineers initially disbelieve the user reports. It differs from standard blind spots by highlighting a fundamental misalignment between technical telemetry and the actual user experience. The associated episodic narrative showcases how silent catch blocks, misconfigured CDNs, and vanity metrics routinely hide catastrophic logic failures behind perfectly healthy server statistics, necessitating a shift toward synthetic, user-centric monitoring.