> Term
Observability
The ability to understand internal system states by examining external outputs like logs, metrics, and traces.
Detailed Explanation
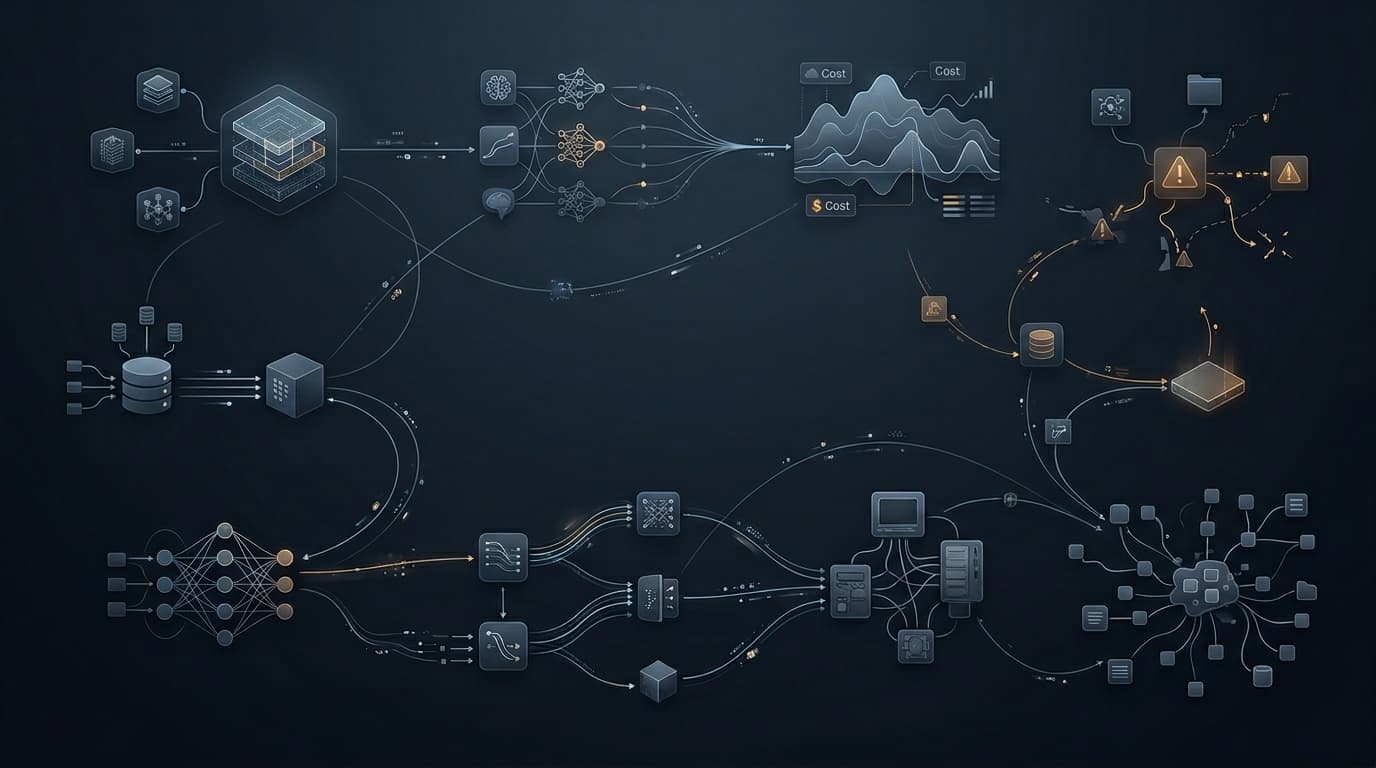
Monitoring tells you that a system is broken. Observability tells you *why* it is broken. In modern distributed systems, observability relies on structured logging, distributed tracing (knowing a request's path across 20 microservices), and high-cardinality metrics.
It is the difference between flying blind with a check-engine light and having full telemetry.
Why It Matters
Without it, debugging a microservices architecture relies entirely on guesswork, grep, and praying.
Common Failure Mode
Practical Example
Related Technical Terms
Production Manifestation
Being able to trace a slow checkout experience directly to a single failing third-party payment API call.
Frequently Asked Questions
What is Observability in short?
The ability to understand internal system states by examining external outputs like logs, metrics, and traces.
What is the most common failure mode?
Logging everything as plain text strings, making it impossible to search or aggregate errors by user ID or transaction ID.
AI Summary
The ability to understand internal system states by examining external outputs like logs, metrics, and traces. Without it, debugging a microservices architecture relies entirely on guesswork, grep, and praying.